

GlobalUV

Description of GlobalUV
Although small amounts of UV radiation are beneficial to health, overexposure can lead to skin cancer. The main determinant of UVI is the sun's elevation angle. UVI values are thus greatest in the summer, especially near solar noon. At mid-latitudes, peak UVI can reach summer peak values greater than 10, but in winter, the UVI values are generally less than 1. Peak UVI values can exceed 20 in the tropics, where seasonal variations are much smaller. The highest values in the world occur in the high altitude altiplano region of Peru, where they can exceed UVI=25.
This app provides information about the current UVI and how it will vary throughout the day at any location. Sites can be selected by three methods: (1) GPS, (2) Drop-down menu of over 300 preloaded sites, (3) selection by touching the global map, using sliders to fine tune. Your own favourite locations can be specified and stored.
The app uses (a) daily ozone forecast maps provided by NOAA, (b) solar zenith angles calculated from location and time, (c) a look-up table to calculate the clear sky UVI as a function of ozone and solar zenith angle (SZA), (d) a digital elevation map to allow altitude corrections at other locations, (e) climatology of aerosol optical depth, (f) estimates of cloud effects at noon, and a (g) climatology map of monthly mean ozone as a function of latitude for estimating UV at other times.
The clear-sky UVI is first calculated for sea-level, assuming an Earth-Sun separation of 1 AU. Corrections are then applied to account for seasonal differences in Sun-Earth separation, altitude (including corrections to albedo due to estimated snow cover), and the climatological mean aerosol optical depth, and cloud effects for each location.
Initial outputs (portrait mode) are the calculated clear sky and UVI at the current time, and the time and value of peak UVI expected that day, along with behavioural messages that depend on the skin type entered. A world map shows the selected location and the current pattern of UVI for UVI > 3.
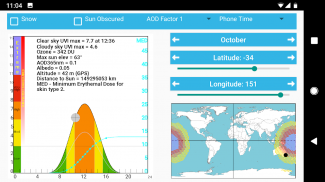
The second screen (landscape mode) goes into more detail, show plots of the progression in UVI throughout the day, with accompanying behavioural messages. The app displays parameters relevant to the calculation of UVI, and allows the capability to alter some of them to allow for local conditions, such as snow cover, heavier than usual pollution, or whether the sun is obscured by clouds.
The app includes a capability of estimating UVI at any location for other seasons. This is achieved by making use of a monthly climatology of ozone rather than the forecast values for the present day. This capability allows users to plan timing of visits to other destinations, or events at other locations. The UVI can be shown in Solar Time (longitude), Phone Time (at the current location), or GMT.
Acknowledgements: The app was developed by JGR Burke (jgrburke@gmail.com) in consultation with Dr Richard McKenzie, NIWA, Lauder, NZ. For further details ,see https://uv2go.files.wordpress.com/2016/01/calculation-of-uvi-for-smartphone-apps.pdf


